


04 Mar San Diego Multifamily Supply Forecast
San Diego Multifamily Supply Forecast- Q1 2025
Projected Supply Growth
The San Diego multifamily supply forecast for 2025-2026 has seen an uptick, with projected completions increasing by 3.3% in 2025 and 11.5% in 2026. However, the decline in units under construction has been gradual, contrasting with the rapid expansion seen between 2021 and 2023. This shift signals evolving market conditions.

Current Development Activity
In 2025, new multifamily supply is expected to be the second highest since 2008, surpassed only by 2024. However, extended construction timelines have delayed some projects, pushing their completion into 2026. The under-construction pipeline peaked at 1.275 million units in 2024 but remains robust, with over 500,000 units anticipated for delivery in 2025. Despite this, the pipeline has contracted by 7.2% year-over-year following substantial growth in 2022 and 2023.
Shifting Market Composition
The composition of new multifamily supply has evolved since 2019. Market Rate and Partially Affordable units, which accounted for 84.3% of new supply in 2019, have steadily declined, with projections indicating a drop to 77.5% by 2025. Meanwhile, Affordable Housing and Single-Family Rentals (SFRs) have gained market share. Affordable housing supply is expected to grow by 16.3% by 2027, while SFRs are projected to see a significant 188.5% increase over the same period.

Trends in New Construction
Multifamily construction starts saw a sharp decline in 2024, with only 298,023 units initiated in the first three quarters—a 40% drop from 2022 and 2023 levels. Expectations for federal interest rate cuts have diminished, as monetary policy shifts to a “higher for longer” stance. As a result, construction activity in 2025 is expected to remain at 2024 levels.
Extended Project Completion Timelines
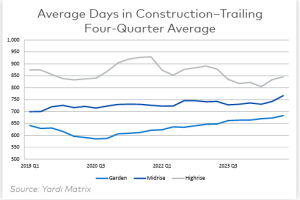
Construction completion times have increased significantly, especially for garden and mid-rise developments, reaching their longest durations since 2015. In Q4 2024, garden-style projects took an average of 694 days to complete, up from 676 days in the previous quarter. Mid-rise developments required 839 days, exceeding the Q4 2023 average of 768 days, while high-rise projects took 940 days, up from 850 days. These delays further impact the availability of new supply.
Future Development Pipeline
As of Q4 2024, the planned construction pipeline reached 1.14 million units, slightly above the 2023 average of 1.12 million. Despite financing challenges, the prospective development pipeline expanded by 10.6% year-over-year, reflecting sustained developer confidence. However, given prolonged project timelines, many of these developments will take years to come to fruition.
Market Outlook and Key Takeaways
While multifamily construction starts have declined nearly 40% compared to 2022-2023, a significant number of units are still scheduled for completion. The 2025 supply forecast anticipates a 3.3% increase, followed by an 11.5% rise in 2026. With high interest rates and long development cycles, new supply is expected to bottom out in 2027 before beginning a gradual recovery. Investors and developers will need to adapt to these evolving market dynamics in the years ahead.